Stock Workbench
Research, plans, and the ledger in one place
A research and ledger workbench for China A-shares and Hong Kong stocks. One AI analysis agent gathers data, reasons, and writes the report; positions and orders live in my own ledger. No broker connection, no auto-trading.
What it can do
- 01One agent runs the whole chain
Every request goes to a single Analysis Agent. It reads the full method handbook, decides what data and sources to pull, and works from collection through analysis and decision to the final report.
- 02Program computes, model judges
Indicator math, state recognition, scenario probabilities, and order sizing are computed by the program from rule tables. The model only makes judgments the rules cannot cover, and every conclusion must cite evidence. Validation points out problems and fixes — it never writes conclusions.
- 03Conclusion first, evidence after
Reports come in six blocks: action advice, three scenarios, why, diagnosis and attribution, bull-vs-bear verdict, and risks and basis. The opening answers whether to buy, whether to sell, and how to place orders.
- 04Adversarial bull-bear debate
Bull and bear are two independent studies: they share the same fact baseline, cannot see each other's arguments, and each returns every evidence-backed argument. The main model then rules by answering four questions.
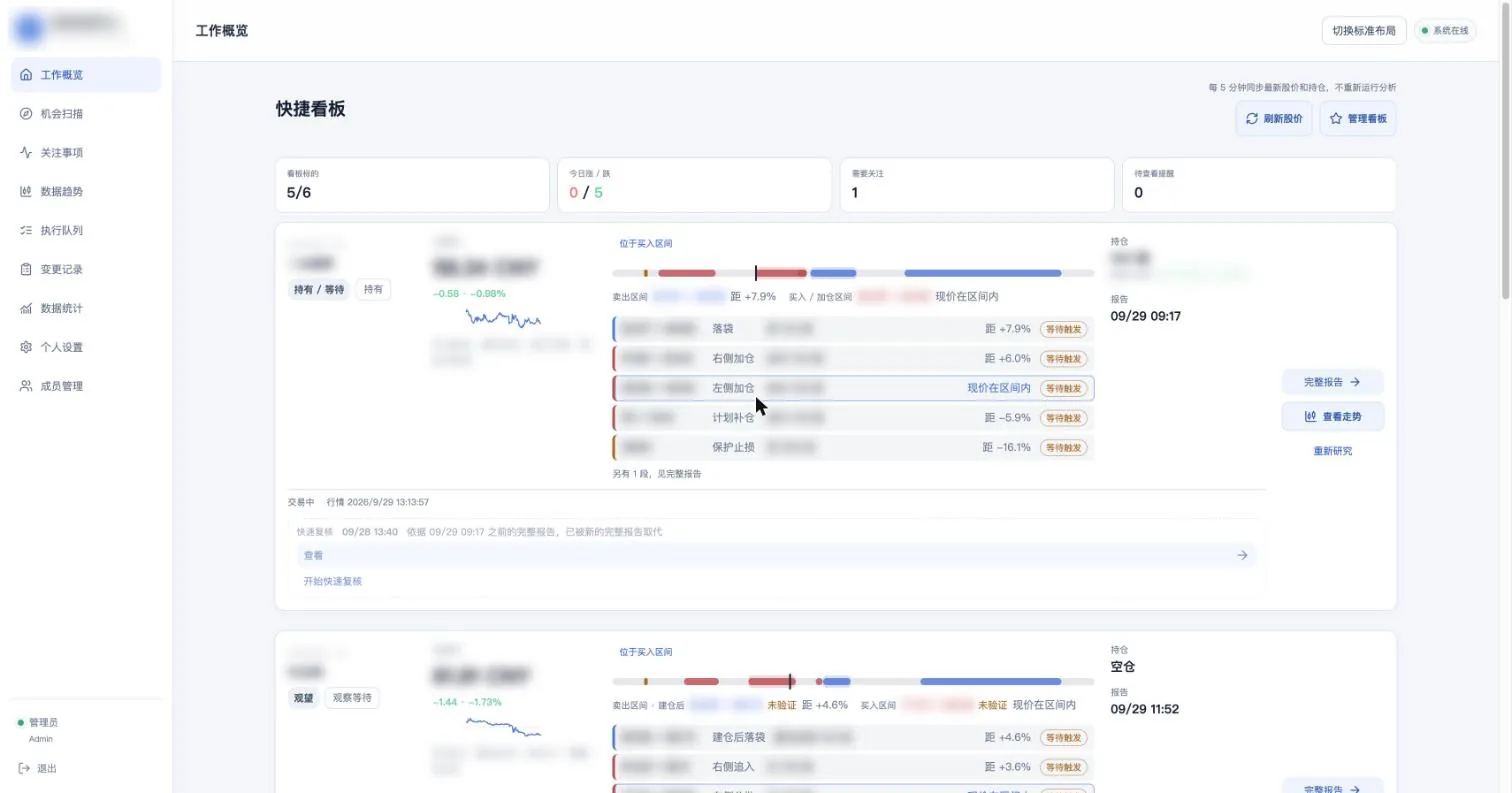
- 05The dashboard in one screen
Each stock gets one card with its price, buy and sell ranges, and staged plan, showing which range the price sits in and how far the next trigger is.
- 06Every number has a source
Every number in a report must be traceable to observed data, a computation, or text actually read — otherwise publishing is blocked. Quotes must match the source verbatim; real data gaps are disclosed, never papered over.
- 07The ledger constrains everything
Cash, holdings, and cost basis come from a real ledger, and trade risk is checked against it. A recorded order becomes a fill only after later prices actually touch its limit.
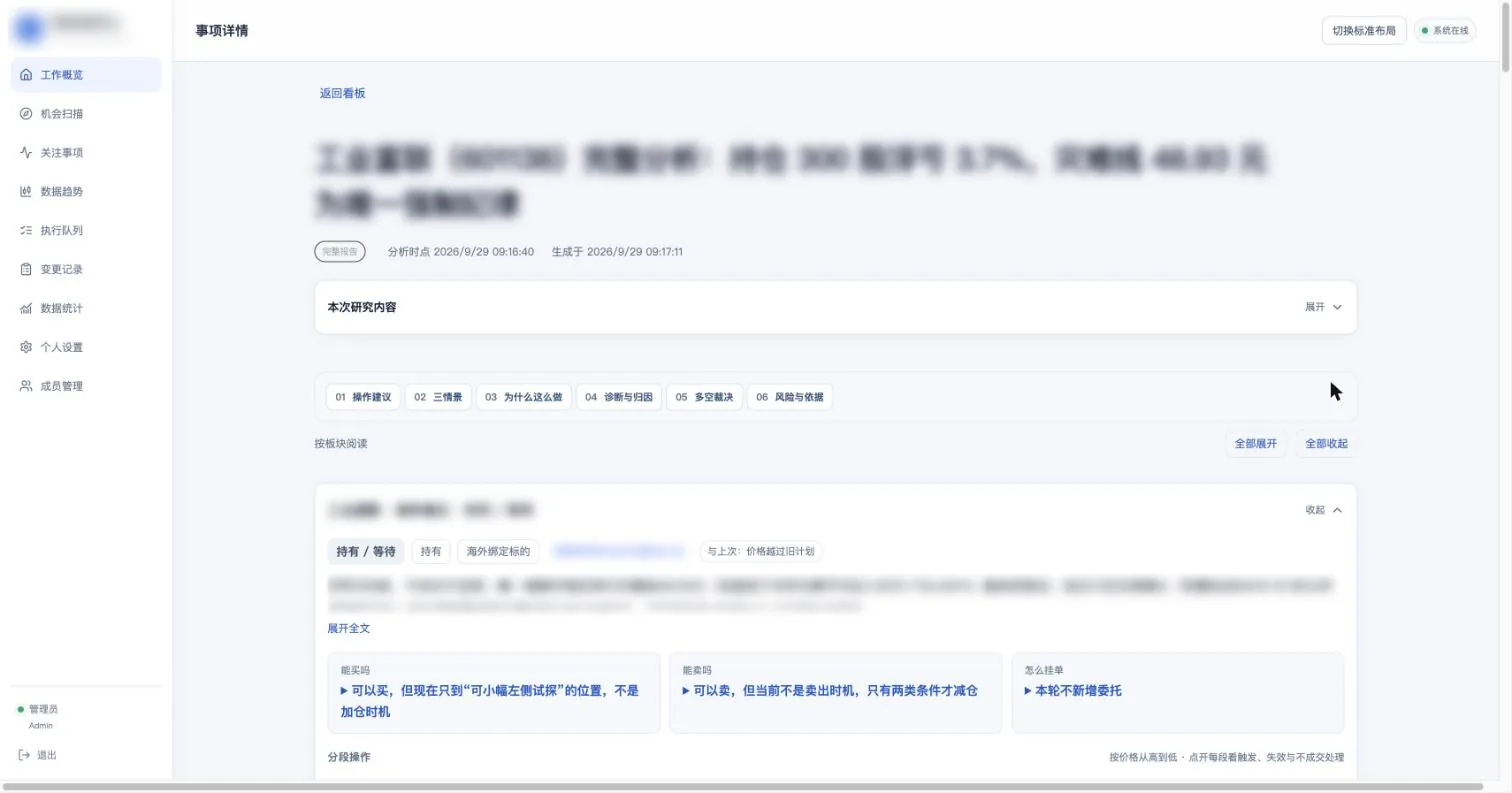
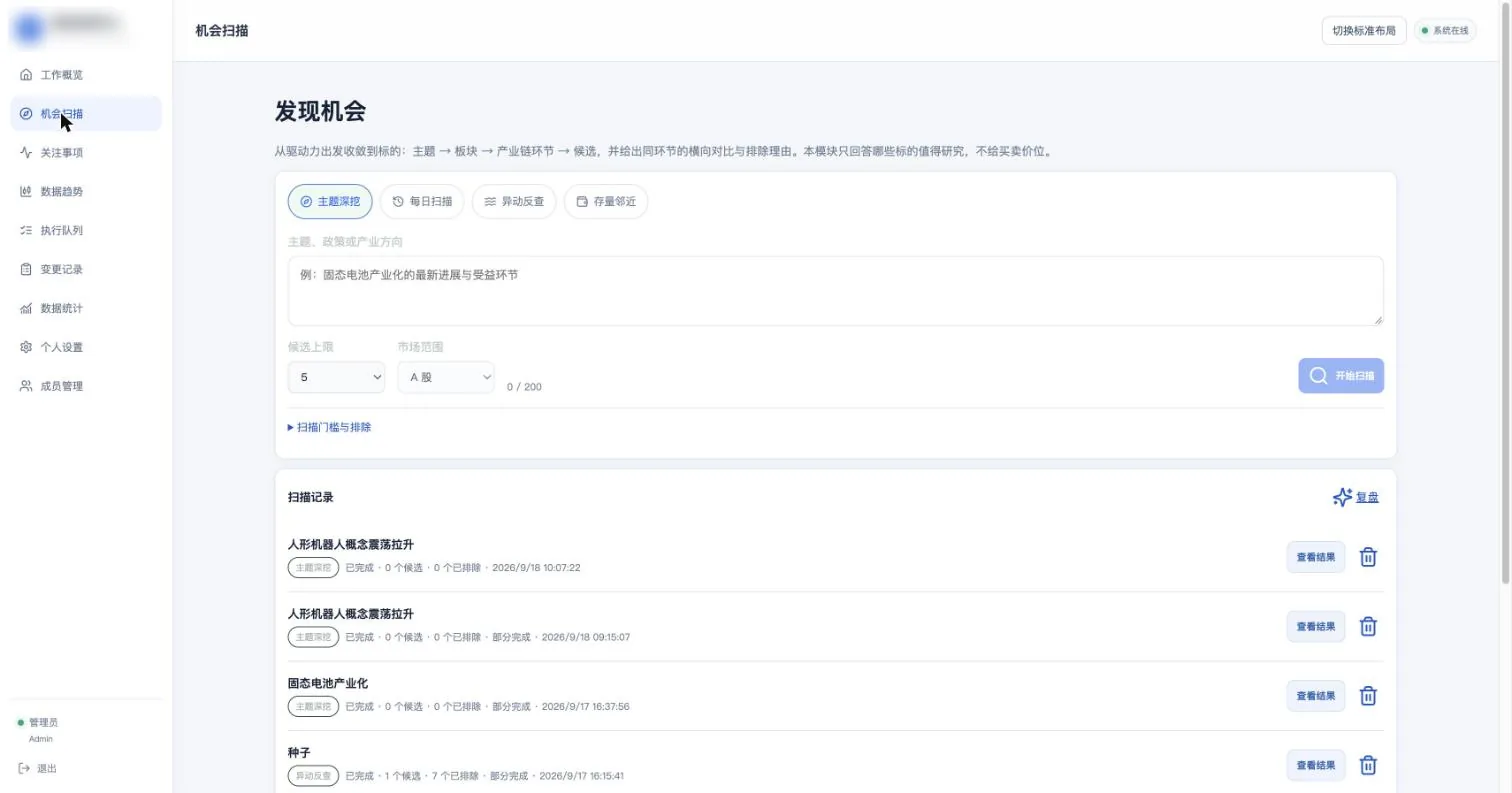
Screenshots come from the live version. Holdings, cost basis, prices, stock names, and the app name are blurred.
Why I built it
The slow part of researching a stock is not writing the conclusion. It is doing the same things again and again: collecting data, checking it against what I hold, and re-reading why I made a call. A chat tool can give an answer, but the answer does not turn itself into a report, and it does not know what I own or how much cash is left.
Stock Workbench puts that chain in one place. The agent does the research, the conclusion lands in a time-stamped report, and holdings, orders, and fills live on the same ledger, so the next round of research continues from the ledger.
How one research run goes
- Pick a stock on the dashboard, or take one from the opportunity scan shortlist.
- Start a full analysis, or type my own question.
- The agent reads the handbook and references as needed, collects market data and sources, analyzes, decides, and writes the report. While it runs, only research stages and sub-task titles show, never internal drafts.
- Buy and sell ranges from the report sync to the dashboard. I decide whether to act, and record real fills back into the ledger.
How it is built: inside the research agent
From the outside it is “click, wait about fifteen minutes, get a report.” This section takes it apart: how the agent is built, what it thinks about, and what it does at every step.
Not a chat window — a resumable research pipeline
Each full analysis is a Cloudflare Workflow run: a Durable Object holds the research state, and checkpoints are written to R2 twice per round, before and after each action. Model timeouts, provider 502s, or a deploy mid-run can all resume from the last checkpoint; tasks paused by network failures auto-resume after five minutes (up to three times). The page just says the analysis is running.
There is no budget for turns, tokens, searches, or wall-clock time. The run stops for exactly three reasons: the method is complete, a real failure paused it, or I stopped it. Whether the research is done — not whether the budget ran out — decides when it ends.
The method handbook is the prompt
The agent’s system context is not a few lines of persona. It holds the full method handbook: an eleven-hundred-line main handbook (a five-stage decision machine: scene → collection → analysis → decision → report) plus the project’s execution conventions. The handbook version is fixed when the task starts, and that one version governs the whole run. Another 24 reference documents — data-source pitfalls, backtest records, field mappings — are listed as a table of contents only, and the agent pages through them on demand with methods.read. The handbook defines the behavior; updating the handbook changes the behavior, with no code changes.
The program and the model each own half
This is the most important line in the whole design: judgments that data can decide are computed by the program from rule tables; only what the rules cannot cover goes to the model.
| Program (rules, auditable) | Model (judgment, must cite evidence) |
|---|---|
| Real clock, instrument identity checks | Scene call: overseas-bound or not, which sector index, which international anchors |
| Real ledger: cash, holdings, cost, T+1 sellable quantity | Which peers to compare, which search queries, which announcement texts to read |
| Data-gate list: auto-fetch quotes, daily bars, financials, announcements, money flow, valuation history; check each minimum | Turning events into a causal chain, with evidence attached |
| Mechanical math: technical indicators, valuation percentiles, peer comparison, board lots and price ticks, risk arithmetic | Dimensions the rules cannot reach: fundamentals, catalyst strength |
| States (trend, capital, relative strength) from rule tables; scenario probabilities from backtest-calibrated weights | The bull-vs-bear verdict: answer four questions, set the final action |
| Validation: structure, evidence, numbers, method coverage, orders — report problems with fixes | Deciding whether to accept a data gap, and how to disclose it |
Validation points out problems and how to fix them; it never rewrites conclusions. A wrong number is not quietly corrected — it is sent back.
Step by step, from request to report
- Before the model acts, the program runs first: real clock, instrument identity, real ledger, the data-gate fetches, historical reports. The model’s first turn already has time, identity, ledger, and data in hand — no turns wasted on “what time is it” or “which stock is this.”
- Scene (scene): the model’s first action must be a standalone scene declaration — overseas-bound or not, which sector index for an A-share, which US/HK anchors for an overseas-bound name. This is a judgment the program cannot make; once declared, the program fetches international data accordingly.
- Collect (collect): the program fetches its list automatically; the model adds what only it can decide — policy-background search terms, topic searches, which announcement texts to read. Data gates check actual results, not call counts: money flow may be logged as an exception only when both Eastmoney and Sina actually failed; valuation history short of 1,000 trading days cannot be replaced with other data.
- Preprocess (preprocess): technical indicators, financial metrics, valuation percentiles, and peer comparisons are computed mechanically by the program; the model consumes results. Derived calculations are not allowed before collection completes.
- Analyze (analyze): the model writes the diagnosis and the causal chain, attaching an evidence ID to every claim; major judgments are delegated to a BULL/BEAR debate (next section). Every tool response is stored as evidence with an ID and a hash, and all later reasoning must cite those evidence IDs.
- Decide (decide): judgments first, essay later. Report-level judgments (claims, risks, debate, unresolved) and per-instrument judgments (position state machine, zones, scenarios, continuity, paths) are submitted in batches. The program checks each immediately: whether zone anchors are legitimate, whether probabilities match the scores; order sizing (board lots, price ticks, sellable quantity, cash and risk) is computed and returned directly.
- Report (report): the program merges every judgment into the full report, verifies it in one pass, refreshes quotes to re-check zone positions, then publishes and archives. At this last step the model submits only the title, the conclusion, and answers to the three questions — no chance to inject new numbers into the finished report.
Adversarial debate: the bear speaks first
Once all data gates pass, the main agent can delegate two independent studies — BULL and BEAR. They share the same fact baseline, cannot see each other’s arguments, and cannot see the main candidate. Each returns every evidence-backed argument — no cap on count, but each must cite evidence that actually exists. The main model then rules by answering four questions: What is the strongest argument for selling? If I am wrong, where am I most likely wrong? Which pieces of evidence conflict? Is the opposition strong enough to overturn the current call? Adding new text does not automatically invalidate existing arguments, but changed evidence invalidates the sub-studies that depend on it.
Numbers and quotes that fail the checks never ship
- Every number in the report (including 万/亿/% conversions) must trace to observed data, a computation, or text actually read — otherwise publishing is blocked.
- Quotes must match the source verbatim; on mismatch, the program attaches the passage around the number from the source to the error.
- Quote checks, numeric assertions, risk evidence, method coverage, and order sizing each have their own gates; failing any one blocks the archive.
- Real data gaps must be disclosed: a report may ship with explicitly written gaps, but it cannot carry executable orders, and it cannot pretend the gaps are not there.
Beyond the report: continuity, quick reviews, intraday checks
- Continuity: judgment material automatically carries past reports and open orders. With a previous report on file, the new one must state “old plan → what happened → what changed → what to do”; if price has crossed the old zones, the plan is declared invalid; every open order gets KEEP/MODIFY/CANCEL, and a kept or modified order must sit inside the current zones.
- Quick review: the intraday routine re-check uses the day’s full report as its baseline. The program refreshes data and computes a change list — zone transitions, stop hits, money-flow reversals, new announcements — each item tagged with its minimum response level; the model responds item by item without re-collecting the baseline’s financials and texts. Thesis-level news (earnings preannouncements, restructurings, major-holder moves) is never adjudicated on the spot: protective actions first, then a full analysis takes over.
- Intraday plan check: after a full analysis sets the plan, “check the plan” runs during the session without calling the model — enforced rules and path triggers only. If a rule hint conflicts with the report’s action, I decide whether to run a full analysis again.
When things fail
Transport failures retry within the same call with backoff — a broken stream falls back to non-streaming; if the main model keeps failing, a fallback model finishes that step. A paused task shows the pause reason and a continue button on the page — a platform failure is never dressed up as “the model did not respond.” Checkpoints make every interruption resumable: resuming keeps collected material and completed stages, and never restarts the whole flow.
What it costs
From the most recent real run: a full analysis takes about 12 minutes and 24 main-model calls, with roughly 3M input tokens (about half served from cache) and 95K output tokens. Earlier versions spent 20+ minutes on the report stage alone — the whole report was written before any check, so one wrong field meant rewriting everything. After the “judgments first, compose later” rebuild, generating the report itself takes about a minute.
What makes it different
- Reports and ledger check each other: advice is not made up. Positions, cash, and cost come from the ledger, and risk is checked against it.
- One range algorithm: reports and the dashboard share the same buy/sell range detection, so the numbers never disagree.
- Discovery and deep dives are separate: the scan compares and only answers “worth researching?”; the deep dive goes down to prices and share counts. One is cheap, the other precise.
- Swappable models: works with DeepSeek, OpenAI, Kimi, MiniMax, and others, and a fallback model finishes the step when the main model fails.
Boundaries
- No broker connection and no automatic order placement.
- Reports, plans, and finished tasks never change holdings. A position only changes through fills I confirm or entries I add explicitly.
- Market data is fetched only during A-share and Hong Kong trading windows.
- It is my own research tool. Nothing it outputs is investment advice.
Under the hood
The front end and API run on Cloudflare Workers, business data lives in D1, full analyses run step by step on Workflows, research state is held in a Durable Object with checkpoints written to R2, and long reports and raw archives also go to R2.